Simplify Passenger Journeys with Precision Wayfinding

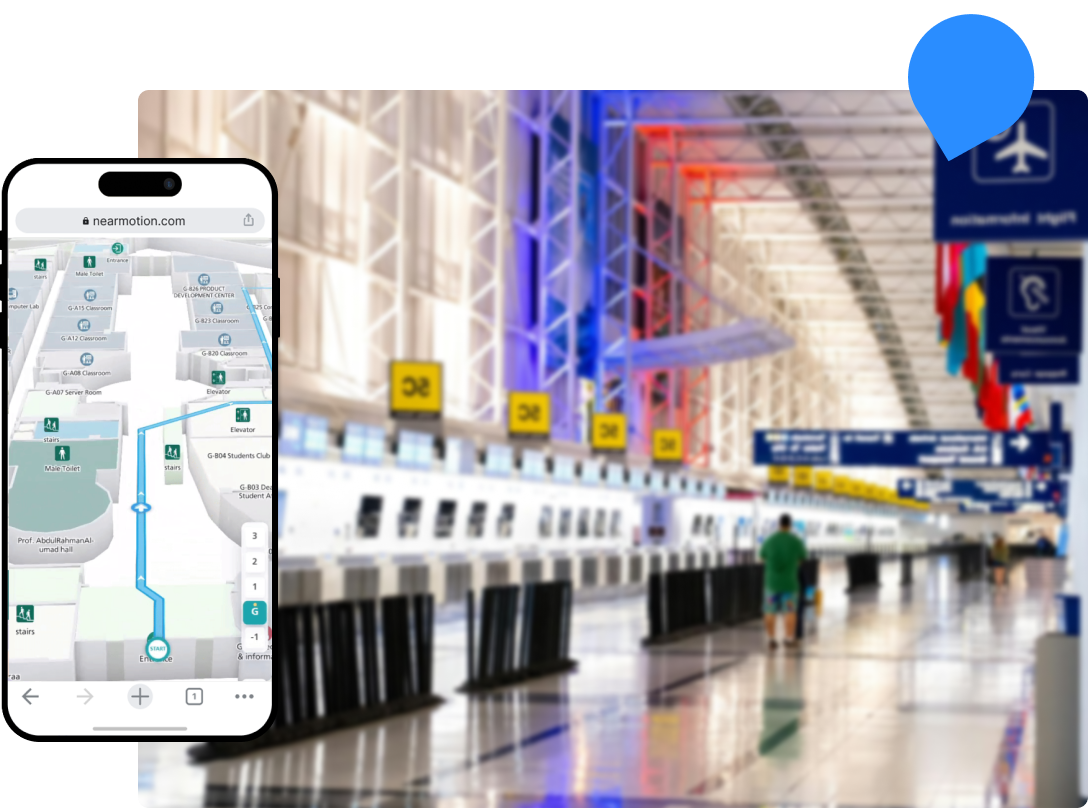
Simplify passenger journeys, improve efficiency, and enhance security. NEARMOTION’s precision wayfinding guides travelers through complex airports and transit hubs, addressing congestion, gate changes, and PRM management. Our platform enhances passenger flow and maximizes non-aeronautical revenue.

How NEARMOTION Works for Airports & Transit

NEARMOTION empowers airport and transit managers to effortlessly create and deploy intelligent digital maps, transforming passenger navigation. Seamless implementation is crucial for always-on transit environments.

1

Map Your Hub: Digitize your airport, train station, or transit center layout.

2

Customize & Integrate: Add gates, terminals, retail, amenities; integrate real-time flight/train info.

3

Deploy Seamlessly: Publish interactive maps to airport apps, digital signage, or kiosks.

4

Analyze & Optimize: Gain insights into passenger flow and congestion to optimize efficiency and revenue.

Airports & Transit ROI Calculator

Calculate the annual savings from indoor navigation in airport and transit environments.

Hospital parametars

Number of hospital beds directly affects staff efficiency savings. More beds = higher potential for navigation time savings. Each bed contributes approximately $1,200-1,800 annually in staff time savings.
Daily outpatient visitors impact missed appointment reduction and staff efficiency. Higher visitor volume = greater savings potential. Each visitor contributes ~$15-25 annually in time and missed appointment savings.
Revenue per visit affects the financial impact of reduced missed appointments. Higher revenue per visit = greater savings from preventing no-shows. Each $1 increase adds ~$2,800 annually in missed appointment savings.
Staff hourly cost determines the value of time saved through better navigation. Higher staff costs = greater savings from efficiency improvements. Each $1/hour increase adds ~$2,700 annually in staff time savings.
Late arrival rate affects missed appointment calculations. Higher rates = more potential savings from navigation improvements. Each 1% reduction in late arrivals saves ~$950 annually.
Average length of stay affects bed utilization optimization. Shorter stays with better flow = more patient throughput. Each 0.1 day reduction can increase revenue by ~$45,000 annually.
Hospital area determines navigation complexity and potential time savings. Larger facilities = greater navigation challenges and savings potential. Each 1,000 sq ft adds ~$75 in annual efficiency savings.

Annual Savings Summary

Total Annual Savings
$3.9M
Staff Time Savings
$803k
Missed Appointments Reduction
$815k
Patient Flow Optimization
$241k
Operational Efficiency
$241k
Emergency Response Efficiency
$2.1M
Thank you! Your submission has been received!
Oops! Something went wrong while submitting the form.

Mall Parameters

Number of stores affects tenant satisfaction and operational efficiency. More stores = greater potential for navigation improvements. Each store contributes approximately $2,500-4,000 annually in efficiency and satisfaction savings.
Daily visitor count directly impacts revenue potential and customer experience improvements. Higher visitor volume = greater savings from improved navigation. Each 1,000 daily visitors adds ~$125,000 annually in revenue and efficiency savings.
Average spend per visit determines the financial impact of improved customer experience and longer dwell times. Higher spending = greater revenue potential. Each $1 increase in spend adds ~$4,380 annually in revenue improvements.
Annual rent revenue affects tenant retention calculations. Higher rent revenue = greater impact from tenant satisfaction improvements. Each $1M in rent contributes ~$75,000 annually in retention and satisfaction savings.
Average visit duration affects customer satisfaction and spending potential. Longer visits with better navigation = higher customer satisfaction and revenue. Each 0.1 hour increase adds ~$875,000 annually in revenue potential.
Mall area determines navigation complexity and potential efficiency gains. Larger malls = greater navigation challenges and improvement potential. Each 1,000 sq ft adds ~$150 in annual operational efficiency savings.

Annual Savings Summary

Total Annual Savings
$3.9M
Revenue Increase
$803k
Tenant Retention Savings
$803k
Operational Efficiency
$815k
Customer Loyalty
$241k
Thank you! Your submission has been received!
Oops! Something went wrong while submitting the form.

Exhibition Parameters

Exhibition space size affects operational efficiency and attendee experience. Larger spaces = greater navigation challenges and improvement potential. Each 1,000 sq ft adds ~$200 in annual efficiency and satisfaction savings.
Number of annual events multiplies the impact of navigation improvements. More events = greater cumulative savings potential. Each additional event adds ~$17,500 in annual efficiency and satisfaction savings.
Attendee count per event affects experience quality and operational efficiency. Higher attendance = greater potential for navigation improvements. Each 1,000 attendees adds ~$52,500 annually in experience and efficiency savings.
Annual booth revenue determines the financial impact of exhibitor satisfaction improvements. Higher revenue = greater impact from improved navigation. Each $100K in booth revenue contributes ~$15,000 annually in exhibitor satisfaction savings.
Registration revenue affects attendee satisfaction and repeat participation. Higher registration revenue = greater impact from improved attendee experience. Each $100K in registration revenue adds ~$30,000 annually in satisfaction savings.
Average booth price indicates event quality and exhibitor expectations. Higher booth prices = greater need for premium navigation experience. Each $100 increase in booth price adds ~$22,000 annually in exhibitor satisfaction savings.

Annual Savings Summary

Total Annual Savings
$3.9M
Space Optimization
$803k
Exhibitor Satisfaction
$803k
Attendee Experience
$815k
Event Analytics
$241k
Operational Efficiency
$241k
Thank you! Your submission has been received!
Oops! Something went wrong while submitting the form.

Office Parameters

Total employee count affects productivity improvements and navigation efficiency. More employees = greater potential for time savings through better wayfinding. Each 100 employees contributes approximately $7,500 annually in productivity savings.
Office area determines navigation complexity and space optimization potential. Larger offices = greater navigation challenges and efficiency opportunities. Each 10,000 sq ft adds ~$1,250 in annual space optimization savings.
Annual rent cost affects the value of space optimization improvements. Higher rent costs = greater financial impact from better space utilization. Each $100K in rent contributes ~$2,000 annually in space efficiency savings.
Average employee salary determines the value of time saved through navigation improvements. Higher salaries = greater value from productivity gains. Each $1,000 increase in salary adds ~$200 annually in productivity savings.
Daily visitor count affects visitor experience and reception efficiency. Higher visitor volume = greater impact from improved navigation. Each 100 daily visitors adds ~$3,650 annually in experience and efficiency savings.
Number of meeting rooms affects utilization efficiency and booking optimization. More meeting rooms = greater potential for space optimization. Each 10 meeting rooms adds ~$5,000 annually in utilization efficiency savings.

Annual Savings Summary

Total Annual Savings
$3.9M
Employee Productivity
$803k
Space Optimization
$803k
Meeting Room Efficiency
$815k
Visitor Experience
$241k
Facility Management
$241k
Thank you! Your submission has been received!
Oops! Something went wrong while submitting the form.

Airport Parameters

Annual passenger count directly affects retail revenue and operational efficiency. Higher passenger volume = greater potential for navigation improvements and revenue increases. Each 1 million passengers contributes approximately $480,000 annually in efficiency and revenue savings.
Terminal area determines navigation complexity and operational efficiency potential. Larger terminals = greater navigation challenges and improvement opportunities. Each 100,000 sq ft adds ~$62,500 in annual operational efficiency savings.
Retail and dining revenue affects the financial impact of improved passenger flow and dwell time. Higher revenue = greater potential from navigation improvements. Each $1M in retail revenue contributes ~$96,000 annually in flow optimization savings.
Average passenger spend determines the value of increased dwell time and improved retail access. Higher spending = greater revenue potential from better navigation. Each $1 increase in spend adds ~$3.75M annually in revenue improvements.
Daily flight count affects operational complexity and passenger flow management. More flights = greater need for efficient navigation and flow optimization. Each 100 daily flights adds ~$1.56M annually in operational efficiency savings.

Annual Savings Summary

Total Annual Savings
$3.9M
Wait Time Reduction
$803k
Retail Revenue Increase
$803k
Passenger Loyalty
$815k
Operational Efficiency
$241k
Staff Productivity
$241k
Thank you! Your submission has been received!
Oops! Something went wrong while submitting the form.

University Parameters

Total student count affects retention rates and campus experience quality. More students = greater potential for navigation improvements. Each 1,000 students contributes approximately $7,500 annually in retention and satisfaction savings.
Campus area determines navigation complexity and potential efficiency gains. Larger campuses = greater navigation challenges and improvement potential. Each 100,000 sq ft adds ~$1,500 in annual operational efficiency savings.
Annual tuition affects the financial impact of student retention improvements. Higher tuition = greater value from preventing dropouts due to poor campus experience. Each $1,000 increase in tuition adds ~$600 annually in retention savings.
Faculty and staff count impacts operational efficiency and productivity. More staff = greater potential for time savings through better navigation. Each 100 staff members adds ~$4,300 annually in productivity savings.
Daily visitor count affects campus reputation and visitor experience quality. Higher visitor volume = greater impact from improved navigation. Each 1,000 daily visitors adds ~$18,250 annually in experience and reputation savings.

Annual Savings Summary

Total Annual Savings
$3.9M
Student Retention
$803k
Operational Efficiency
$803k
Staff Productivity
$815k
Campus Experience
$241k
Visitor Experience
$241k
Thank you! Your submission has been received!
Oops! Something went wrong while submitting the form.

Maximize Your Transit ROI with Spatial Intelligence

Maximize passenger satisfaction, operational efficiency, and non-aeronautical revenue. NEARMOTION transforms transit hubs into seamlessly navigable, profitable environments, delivering measurable ROI.

Challenge/Input

  • Passenger confusion / Stress
  • Congestion at key areas
  • Missed connections
  • Underperforming retail revenue

NEARMOTION Impact

  • Intuitive, stress-free navigation
  • Smoother passenger flow
  • Reduced missed connections
  • Increased retail engagement

Quantifiable Outcome

  • Improved Passenger Satisfaction
  • Enhanced Operational Efficiency
  • Maximized Non-Aeronautical Revenue
  • Increased Security & Preparedness

This directly demonstrates NEARMOTION’s measurable ROI, impacting efficiency and revenue generation.

Precision Wayfinding and Actionable Insights for Seamless Transit

NEARMOTION's precision indoor positioning helps passengers find gates, terminals, and amenities, reducing stress and missed connections. Our spatial intelligence platform analyzes passenger flow and dwell times, providing data to optimize gate assignments, retail layouts, and security checkpoints. This data-driven approach improves efficiency, increases non-aeronautical revenue, and enhances safety.

Key Benefits for Airports & Transit Hubs

NEARMOTION offers comprehensive benefits for airports and transit hubs.

Streamlined Passenger Flow

Guide travelers efficiently to gates, baggage claim, and transport, reducing congestion.

Enhanced Passenger Experience

Reduce traveler stress and anxiety with intuitive maps and AR guidance.

Maximized Non-Aeronautical Revenue

Direct passengers to retail and dining, increasing dwell time and spending.

Real-time Flight & Train Info Integration

Provide live updates on flight/train info directly on the map.

Retail & Amenity Locators

Travelers quickly find shops, restaurants, and lounges.

Multi-modal Navigation

Seamlessly guide passengers between different transport modes.

Improved Security & Emergency Response

Provide clear maps for security and emergency routes, enhancing safety

Rapid Deployment & ROI

Implement with minimal disruption, delivering immediate value and measurable returns.

The NEARMOTION Approach: Your Partner in Spatial Intelligence

Precision Navigation: Industry-leading indoor positioning ensures confident navigation.

Seamless Implementation: Rapid deployment and easy integration minimize disruption, delivering immediate value.

Actionable Analytics: Gain insights into movement patterns to optimize space, staffing, and resources.

Enhanced Visitor Experience: Interactive maps and AR guidance transform journeys, reducing stress and building loyalty.

Measurable ROI: Quantifiable benefits include reduced missed appointments, increased retail dwell time, improved staff productivity, and enhanced emergency response capabilities.

Future-Proof Technology: Cloud-native, IMDF-compliant infrastructure ensures long-term value.

Send Us a Message

Fill out the form below, and our team will get back to you shortly.

Thank you! Your submission has been received!
Oops! Something went wrong while submitting the form.

Find Your Perfect Solution

Ready to transform your retail space? NEARMOTION offers tailored solutions. Discuss with an expert or start building your map for free.